Bioprocess TEA and life cycle assessment (LCA) software.
Compare cost of goods, annual cash flow and a foreground life-cycle inventory by unit operation. Trace each result to materials, labor, utilities, equipment, yield, schedule and uncertainty inputs before mapping authorised background data.
Review disciplineEach value carries units, scenario, range, source type, owner, date, confidence, validity domain, and the output decisions it influences.
LCA scope boundaryA foreground inventory is not a complete, independently reviewed LCA. Background databases, LCIA methods, ISO study governance and independent critical review remain separate requirements unless explicitly included and evidenced in the agreed study scope.
Facility decisionsMore than 50 linked process and commercial inputs · demand-by-volume sizing matrix · whole train count · spare capacity · greenfield · brownfield · co-location · contract manufacturing
Named data ecosystem
Bring recognised LCA and TEA sources into one governed process ledger.
Acatian records exactly which source, version, geography, year, licence and mapping produced a result. Public APIs, authorised file imports, commercial datasets and company evidence stay visibly different—so a connector label never masquerades as decision-grade data.
LCA background data
Map authorised datasets from ecoinvent, Federal LCA Commons and USLCI, UNEP GLAD, openLCA Nexus, AGRIBALYSE, EXIOBASE, Argonne GREET, EPA USEEIO, NETL's LCA Unit Process Library, EU Environmental Footprint, Sphera, PlasticsEurope and IPCC EFDB.
Economic and market evidence
Structure scenarios from the BETO Biofuels TEA Database, Bioenergy KDF, NREL ATB, NREL Cambium, DOE H2A, U.S. EIA, USDA NASS, Eurostat, U.S. BLS, FRED, NETL, CEPCI, ICIS and S&P Global Commodity Insights, subject to each provider's terms.
One foreground model
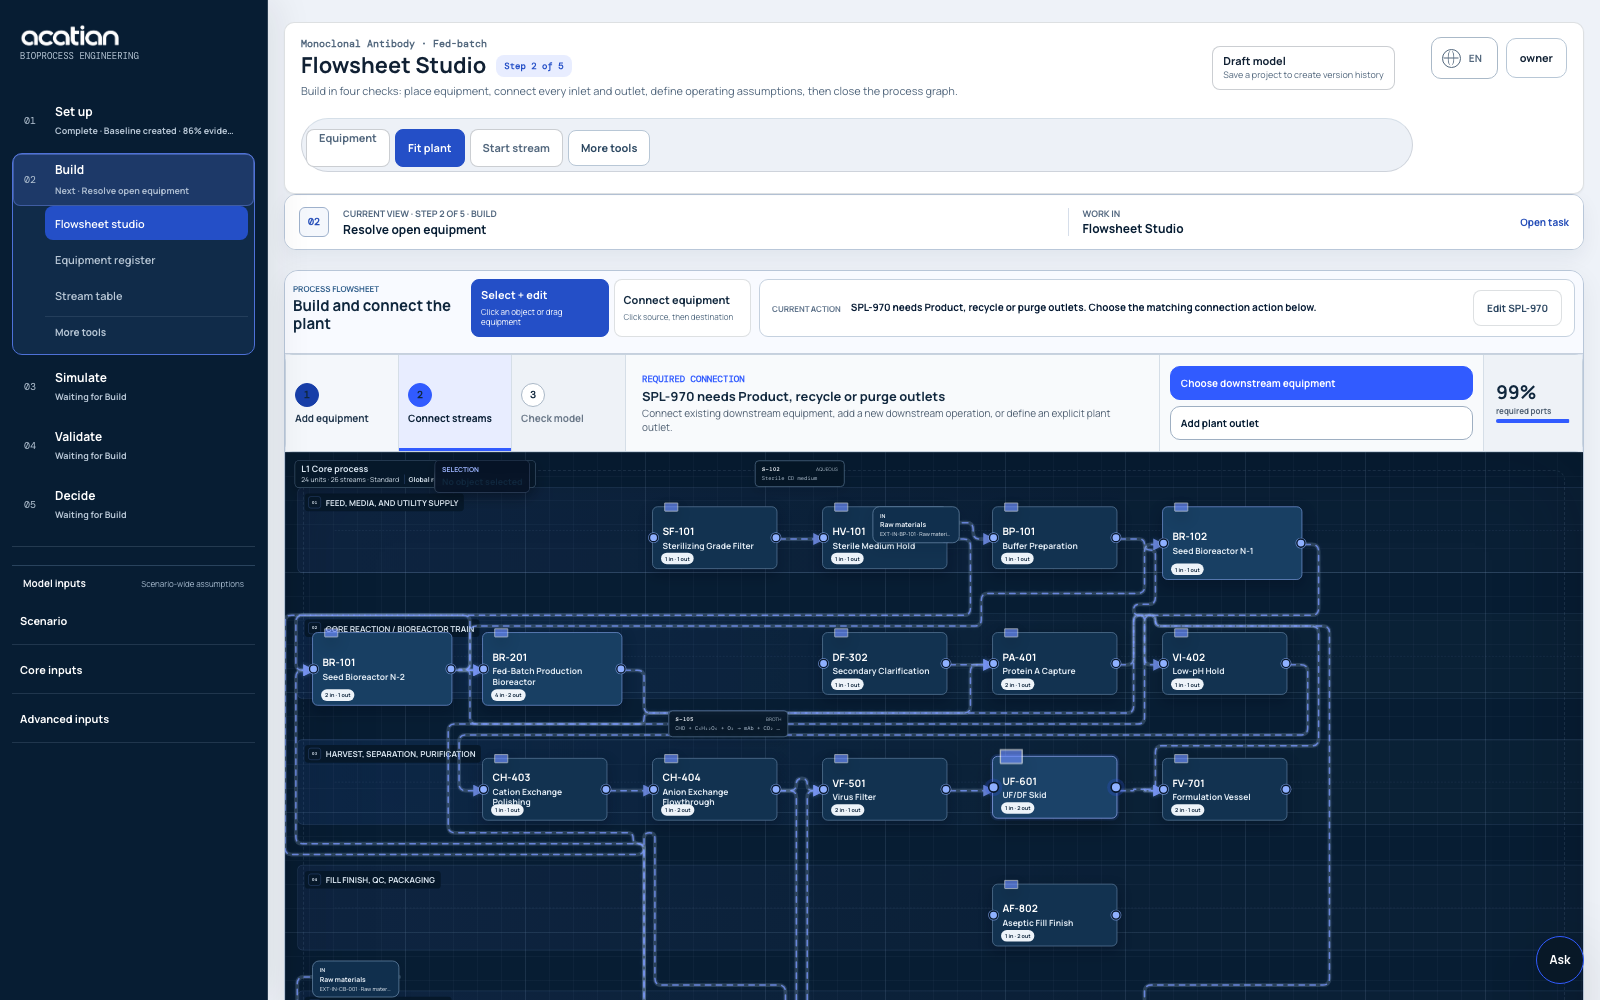
Reactor geometry, supporting equipment, clean utilities, gas supply, CIP/SIP, PAT, labor, consumables, waste and schedule feed both the cost model and life-cycle inventory. Change a process scenario once and inspect its physical, economic and environmental consequences together.
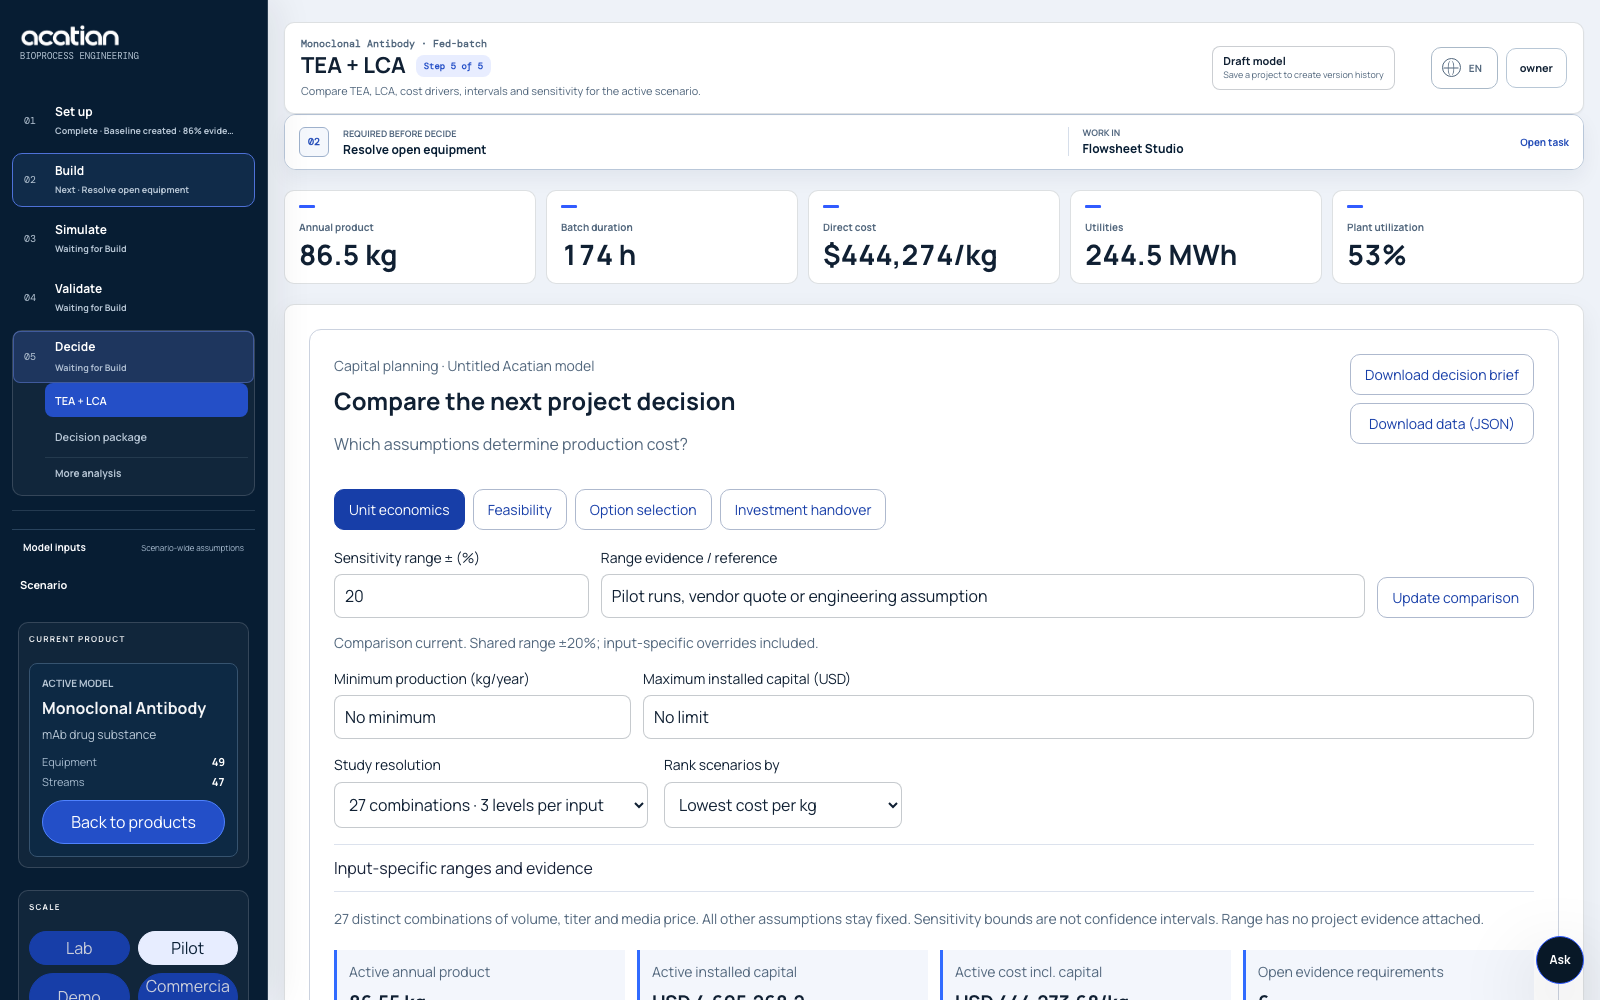
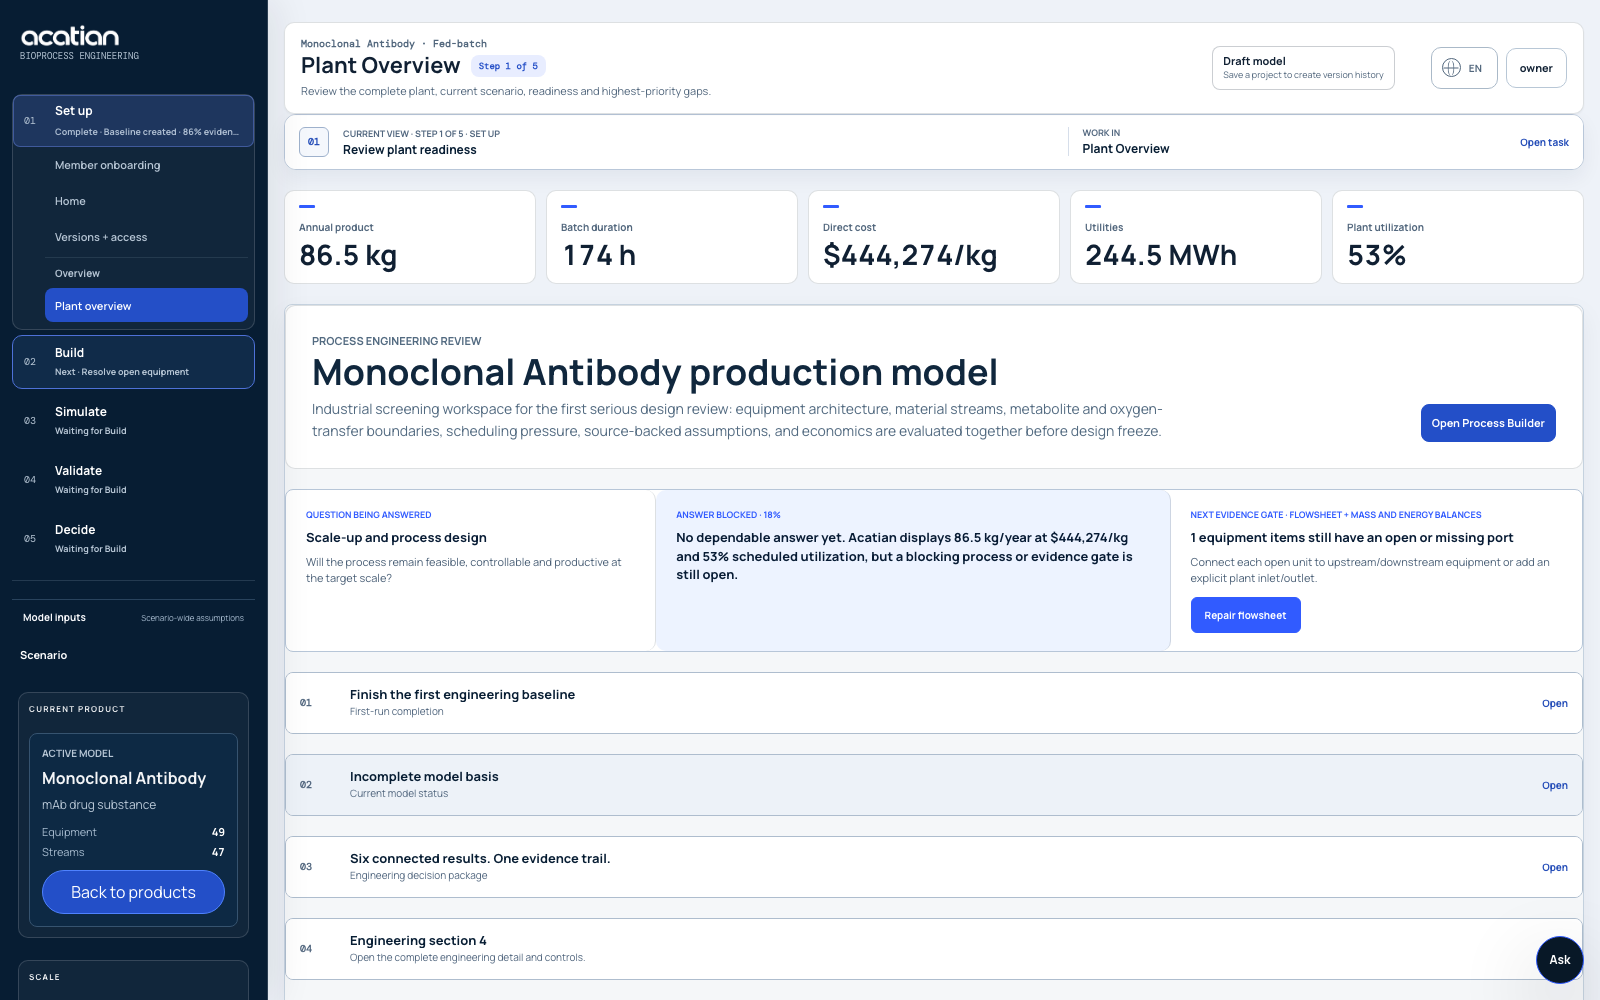
Shared process basisApplication screenshot: cost and utility indicators remain attached to the model and its open review requirements.Traceable calculation chainEvery economic and environmental result resolves to a process stream, unit, schedule, or explicit assumption.
Calculation architecture
Build TEA and LCA from the same reconciled process basis.
Economics and environmental impact become comparable only when scenarios use consistent production volume, yield, utilization, system boundaries and allocation rules. Acatian preserves that calculation chain from equipment and streams to every reported result.
Functional unit and system boundary
Declare the product specification, annual output, location, currency year, study period and LCA functional unit. Define cradle-to-gate or wider boundaries, cut-off rules, co-product allocation, recycling, transport, capital treatment and the foreground-to-background data interface before comparing scenarios.
CAPEX, OPEX and bankability
Size equipment from process duties, then record base cost, scale exponent, material, pressure, installation, piping, controls, buildings, clean utilities, indirects, contingency and escalation. Link raw materials, consumables, labor, utilities, maintenance, waste, yield losses and utilization to COGS, annual cash flow, NPV, IRR, DSCR, payback and break-even results.
Inventory, uncertainty and contribution
Export a unit-resolved life-cycle inventory for materials, energy, water, emissions, transport and waste with geography, technology, year, source and data-quality status. Propagate low, base and high values or sampled distributions and rank the parameters that dominate cost and impact uncertainty.