Bioprocess economics · worked method

Bioprocess COGS scenario analysis: keep cost, yield and released output on one basis.

A useful COGS comparison explains not only what a batch costs, but how many batches release, how much conforming product they deliver and which assumptions move together.
Acatian Blog4 min read · synthetic exampleDeutsch
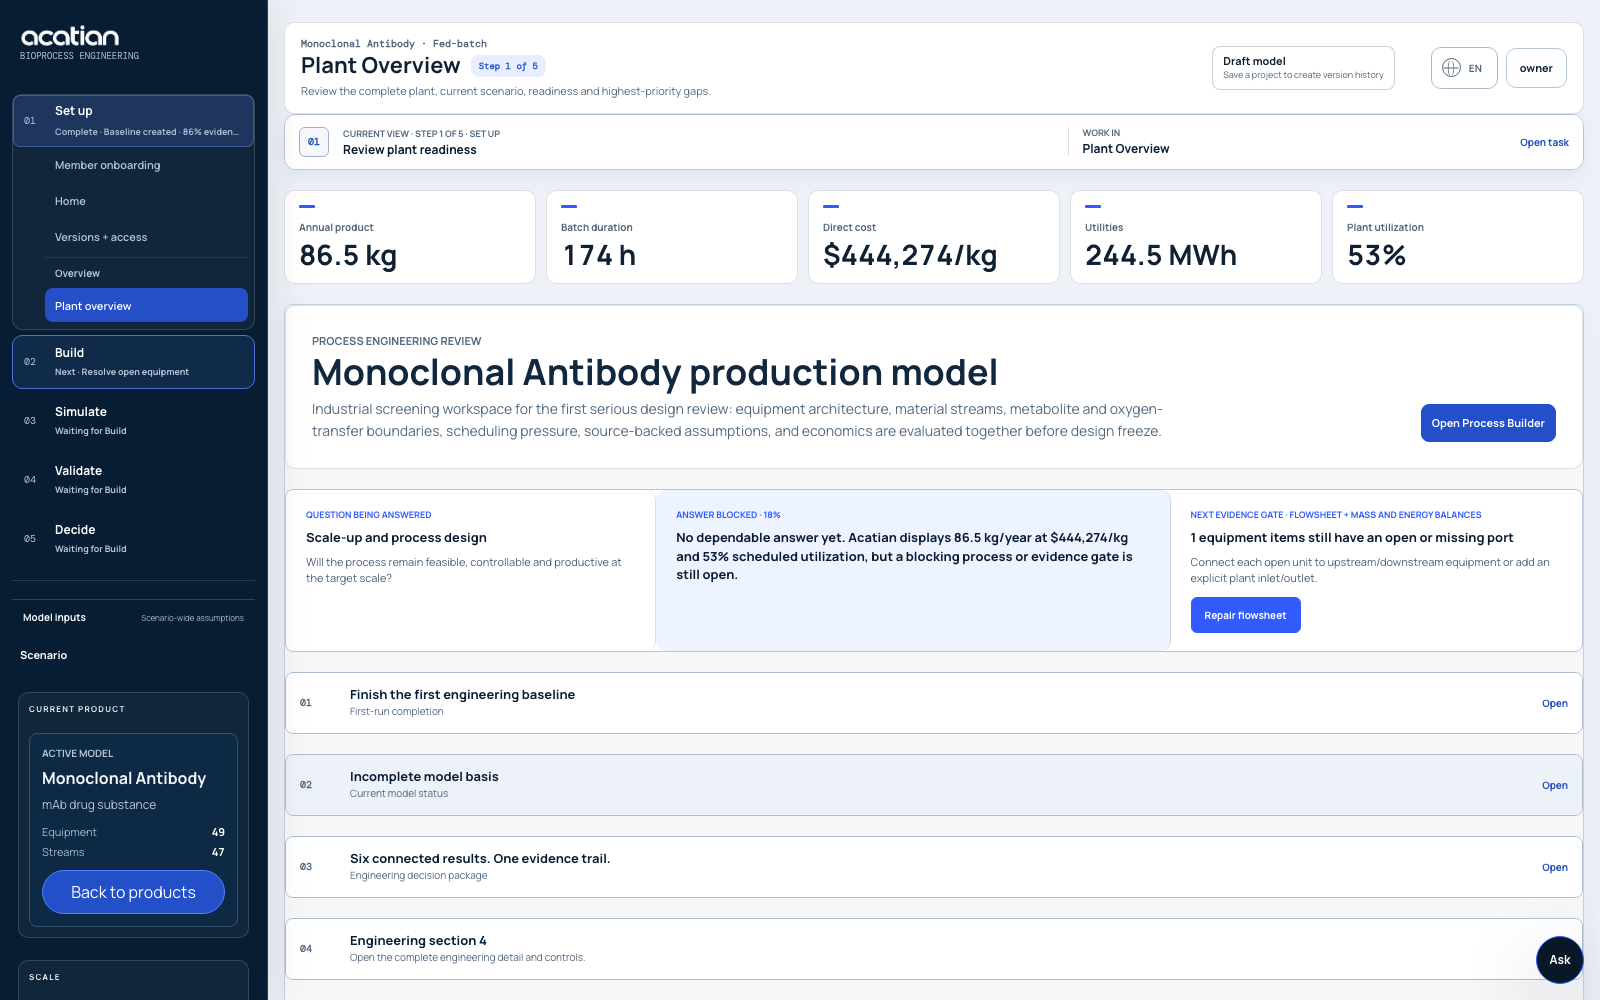
Acatian plant model connecting process assumptions, facility capacity and bioprocess economics
COGS becomes decision-useful when technical yield, release success, schedule and annual cost remain traceable to the same scenario.
01

Calculation boundary

Start with released good product, not scheduled batches.

Annual good product

Annual good product = released batches × conforming product per released batch. Keep scheduled batches separate. A schedule can look fully utilized while failures, rework, holds or yield loss reduce the denominator that actually carries annual cost.

Annual cost

Declare the cost boundary before comparing scenarios: raw materials, consumables, labor, utilities, waste, facility and depreciation, quality and overhead. Keep financing, tax, selling expense and development cost outside unless the named decision requires them.

Unit COGS

COGS = total annual manufacturing cost ÷ annual released good product. Use one currency year, one production horizon and one product-quality boundary. Never mix a steady-state numerator with a ramp-up denominator.

Synthetic worked example

Three scenarios reveal why the denominator matters.

The values below are deterministic teaching data, not customer results, a price forecast or accounting advice. They isolate the combined effect of release success, product yield and annual operating cost.
ScenarioReleased / scheduled batchesAnnual good productAnnual costCOGS
Improved yield29 / 3058.0 kg€5.14m€88,621/kg
Base case27 / 3048.6 kg€5.50m€113,169/kg
Release stress24 / 3036.0 kg€6.00m€166,667/kg
03

Decision review

Challenge the scenario before comparing the headline number.

Coupled assumptions

Yield, cycle time, consumables, utilities, labor and release success are rarely independent. A higher-titer process may shorten campaigns but increase downstream load; a faster schedule may raise changeover demand or queue risk.

Capacity mechanism

Explain whether annual output is limited by demand, batch duration, shared equipment, room occupancy, labor, utility peaks, maintenance or quality release. Utilization alone does not identify the bottleneck.

Uncertainty

Report low, base and high values with sources, owners and validity ranges. Use scenario analysis for correlated changes and sensitivity analysis for individual drivers. Reserve probabilistic claims for distributions that have evidence.

04

Frequently asked questions

Keep the economic interpretation inside the declared boundary.

Which output belongs in the COGS denominator?

Use product that meets the quality and release boundary named by the decision. Keep scheduled batches, successful batches, released batches and saleable product separate so failures and yield loss remain visible.

Does a lower manufacturing COGS mean the process is profitable?

No. Manufacturing COGS excludes any costs outside the declared boundary and does not establish price, demand, tax, financing, development cost or return. Profitability requires a wider cash-flow model.

Downloadable calculation ledgerThe CSV contains all three scenarios, cost categories, released-product denominators and reproduced COGS values.Download the COGS scenario ledger
Research boundaryPeer-reviewed biopharmaceutical economics literature shows why process yield, scale, facility design and uncertainty belong in the same decision model. The synthetic example here remains independent of any specific platform or facility.Review the foundational process-economics paper